Ripple Effects
The impact of military conflict on markets
April 2024
Key Observations
- Markets repriced in April on “higher-for-longer” rates pushing longer duration fixed income and duration sensitive equities lower. Small-cap growth stocks were hit as the two largest securities in the index declining -15% and -37% due to moderating AI spending concerns.
- Escalating conflicts in the Middle East have led investors to question what impact an expanded conflict may have on their portfolios. Increasing oil prices has modestly priced in risk of expanded conflict into neighboring petrostates Iran and Israel.
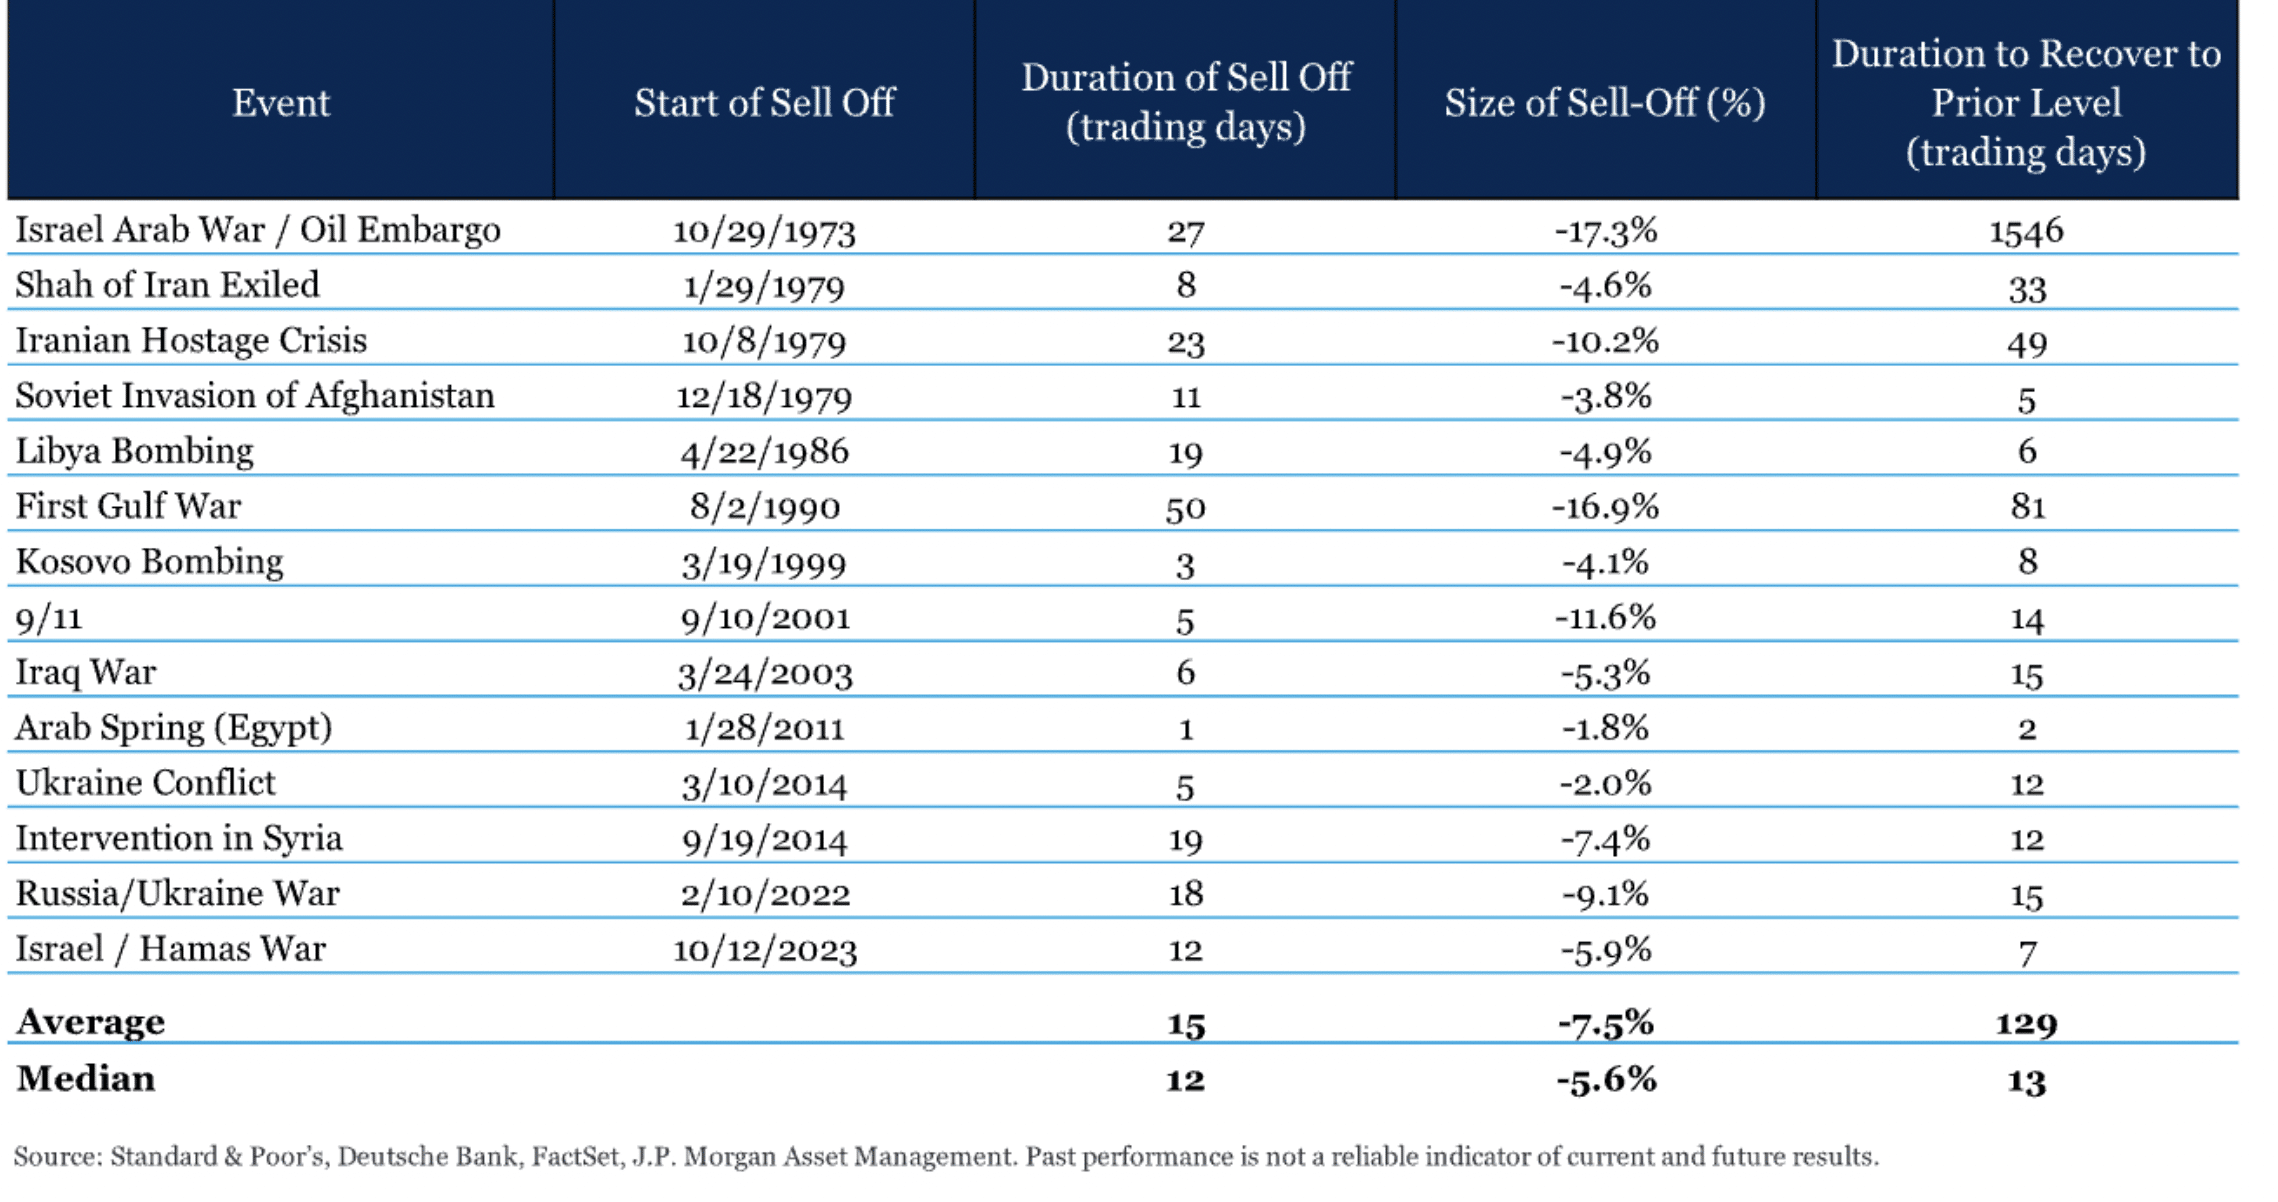
- While these events capture our attention, their fundamental impact on markets tends to be short-lived. With history as precedent, both the duration of a market downturn and the subsequent recovery from such events are typically measured in days rather than months or years.
Market Recap
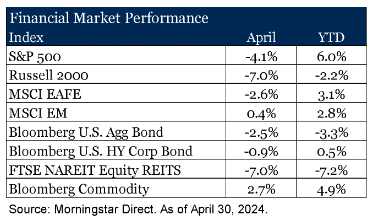
The S&P 500 index departed from its five-month ascent, recording a -4.1% decline. Despite the advance estimate of 1.6% 1Q 2024 GDP growth reported in April, concerns arose as the pace of expansion decelerated from previous quarters, marking a departure from the six consecutive quarters of growth exceeding 2% according to BEA data.
Inflationary pressures persisted as the core Personal Consumption Expenditures (PCE)deflator of 2.8% remained above the Federal Reserve’s
long-term target of 2%, marking a modest acceleration from previous reports. This upward trend challenged interest rate cut expectations and fueled speculation of a prolonged period of higher rates.
With expectations of a stable rate policy in the U.S. and the possibility of rate cuts from other central banks, the resilience of the U.S. dollar continued, marking its fourth consecutive monthly gain, the longest streak since September 2022.
The shift in rate expectations rippled across markets, causing repricing of many assets. In fixed income, longer-duration assets underperformed shorter-duration ones as rates rose. In U.S. equity markets, strength was observed in energy and utilities, which tend to be less sensitive to interest rates, while more traditional growth sectors retreated. Small-cap stocks faced similar, but more acute, headwinds, with the two largest securities (Super Micro Computer and Microstrategy Inc) in the index declining -15% and -37% due to moderating AI-driven spending. This pushed the Russell 2000 index down -7% for the month.
Despite the strength of the dollar, international markets forged ahead for the month. MSCI EAFE outperformed the U.S. and was supported by the continued rally in Japanese stocks. MSCI Emerging Markets witnessed a resurgence, buoyed by China’s performance after enduring a period of underperformance earlier in the year. This positive turn provided a glimmer of optimism amidst global economic uncertainties and trade dynamics.
Expansion of Conflict in the Middle East
We witnessed a direct escalation of conflicts in the Middle East during the month, which stemmed from a retaliatory strike on Israel by Iran, which had been anticipated. While these two nations have been engaged in a shadow conflict for decades, this recent escalation has prompted investors to consider the potential impact of a broader conflict on their portfolios. Below we explore the nature of military conflict and its implications for our investment principles and outlook.
First, let us discuss principles. Military conflicts, much like other external events such as natural disasters, are challenging to integrate into investment strategies. By their very nature, they often arise suddenly and with considerable uncertainty. The inevitability of events with timing that is often unknowable, and their uncertain impact on prices, underscores a fundamental principle of investing: diversification. Diversification acknowledges the reality of imperfect information. With perfect information we would invest solely in the highest-returning asset and disregard all others. However, because we can’t predict outcomes with certainty, thoughtful diversification, without overdoing it, helps establish resilience in the face of unpredictability.
Regarding our outlook, explicitly incorporating conflicts into our assessments is difficult at best. While we cannot afford to ignore them, we also cannot precisely “price” them in allocations. Instead, the possibility of such events becomes part of a broader risk management framework. Given the nature and geographic location of the escalating conflict between Israel and Iran, risk management shifts focus to unexpected inflation, particularly through higher oil prices.
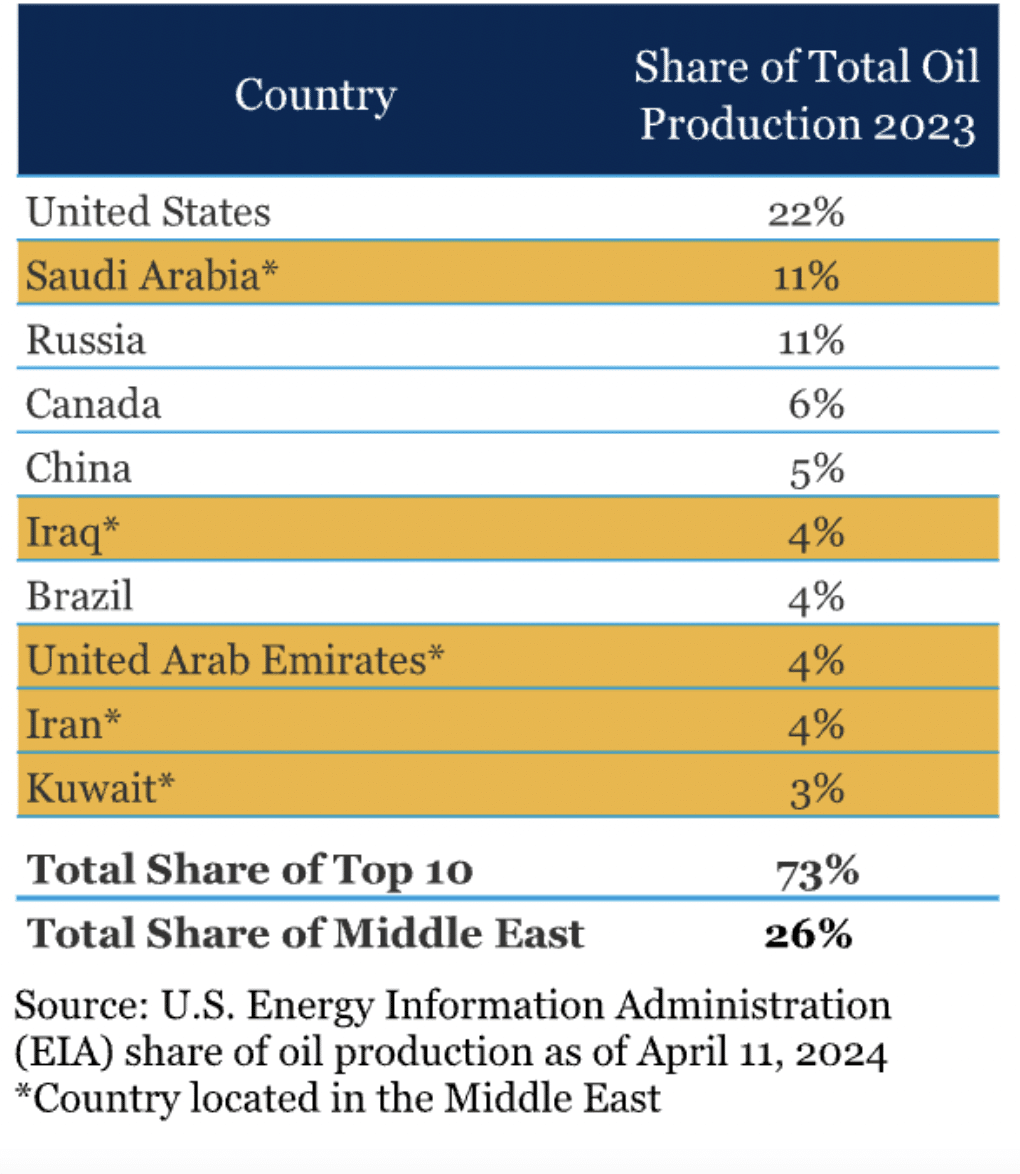
Oil prices initially surged after the outbreak of renewed conflict in the Middle East last October. Although they briefly retreated from their initial rally, oil prices have been steadily climbing this year. The rise in prices is attributed to the conflict expanding into neighboring petrostates such as Iran and Saudi Arabia. Iran’s oil production accounted for 4% of global supply in 2023, while Saudi Arabia, the region’s largest producer, stands at 11%. Markets are sensitive to potential disruptions in supply, especially in a tight oil market with Russian sanctions. Additionally, the U.S. is the largest swing producer and is already near peak volumes. Energy prices are a crucial factor influencing inflation and continue to draw the attention of investors as they await the Fed’s stance on rate cuts. Furthermore, disruptions in the Middle East could exacerbate inflationary pressures by constraining shipping via the Red Sea and/or the Suez Canal. Such events are a reminder of one of the reasons we own real assets in our diversified portfolios. Exposure to the asset class is often of notable value in periods of unexpected inflation.
Ultimately, while these events capture our attention, their fundamental impact on markets tends to be short-lived. With past as precedent, both the duration of a market downturn and the subsequent recovery from such events are typically measured in days rather than months or years.
Disclosures & Definitions
Comparisons to any indices referenced herein are for illustrative purposes only and are not meant to imply that actual returns or volatility will be similar to the indices. Indices cannot be invested in directly. Unmanaged index returns assume reinvestment of any and all distributions and do not reflect our fees or expenses.
- The S&P 500 is a capitalization-weighted index designed to measure performance of the broad domestic economy through changes in the aggregate market value of 500 stocks representing all major industries.
- Nasdaq Composite Index includes all domestic and international common type stocks listed on the Nasdaq Stock Market.
- The S&P 500 Equal Weight Index (EWI) is the equal-weight version of the widely-used S&P 500. The index includes the same constituents as the capitalization weighted S&P 500, but each company in the S&P 500 EWI is allocated a fixed weight – or 0.2% of the index total at each quarterly rebalance.
- Russell 2000 consists of the 2,000 smallest U.S. companies in the Russell 3000 index.
- MSCI EAFE is an equity index which captures large and mid-cap representation across Developed Markets countries around the world, excluding the U.S. and Canada. The index covers approximately 85% of the free float-adjusted market capitalization in each country.
- MSCI Emerging Markets captures large and mid-cap representation across Emerging Markets countries. The index covers approximately 85% of the free-float adjusted market capitalization in each country.
- Bloomberg U.S. Aggregate Index covers the U.S. investment grade fixed rate bond market, with index components for government and corporate securities, mortgage pass-through securities, and asset-backed securities.
- Bloomberg U.S. Corporate High Yield Index covers the universe of fixed rate, non-investment grade debt. Eurobonds and debt issues from countries designated as emerging markets (sovereign rating of Baa1/BBB+/BBB+ and below using the middle of Moody’s, S&P, and Fitch) are excluded, but Canadian and global bonds (SEC registered) of issuers in non-EMG countries are included.
- FTSE NAREIT Equity REITs Index contains all Equity REITs not designed as Timber REITs or Infrastructure REITs.
- Bloomberg Commodity Index is calculated on an excess return basis and reflects commodity futures price movements. The index rebalances annually weighted 2/3 by trading volume and 1/3 by world production and weight-caps are applied at the commodity, sector and group level for diversification.
Material Risks
- Fixed Income securities are subject to interest rate risks, the risk of default and liquidity risk. U.S. investors exposed to non-U.S. fixed income may also be subject to currency risk and fluctuations.
- Cash may be subject to the loss of principal and over longer periods of time may lose purchasing power due to inflation.
- Domestic Equity can be volatile. The rise or fall in prices take place for a number of reasons including, but not limited to changes to underlying company conditions, sector or industry factors, or other macro events. These may happen quickly and unpredictably.
- International Equity can be volatile. The rise or fall in prices take place for a number of reasons including, but not limited to changes to underlying company conditions, sector or industry impacts, or other macro events. These may happen quickly and unpredictably. International equity allocations may also be impact by currency and/or country specific risks which may result in lower liquidity in some markets.
- Real Assets can be volatile and may include asset segments that may have greater volatility than investment in traditional equity securities. Such volatility could be influenced by a myriad of factors including, but not limited to overall market volatility, changes in interest rates, political and regulatory developments, or other exogenous events like weather or natural disaster.
- Private Real Estate involves higher risk and is suitable only for sophisticated investors. Real estate assets can be volatile and may include unique risks to the asset class like leverage and/or industry, sector or geographical concentration. Declines in real estate value may take place for a number of reasons including, but are not limited to economic conditions, change in condition of the underlying property or defaults by the borrow.
Download our 2025 Financial Planning Guide
